Visualizations in Power BI
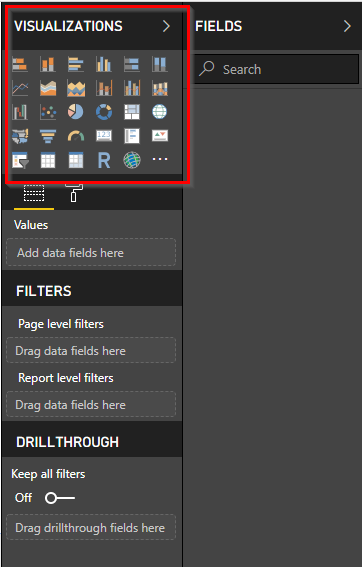
Visuals are the end-result of any business intelligence and Power BI offers many such visualizations that will help to prevent your data in an insightful way. Visuals in Power BI are the basic building blocks and are available in different categories such as charts, treemaps, gauges and various other page formatting tools.

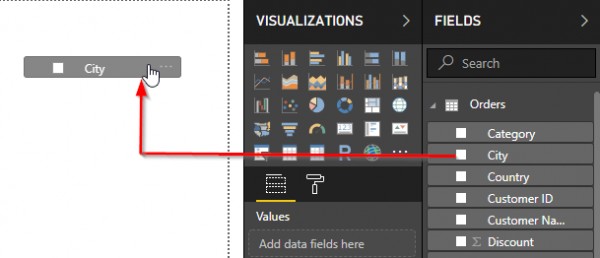
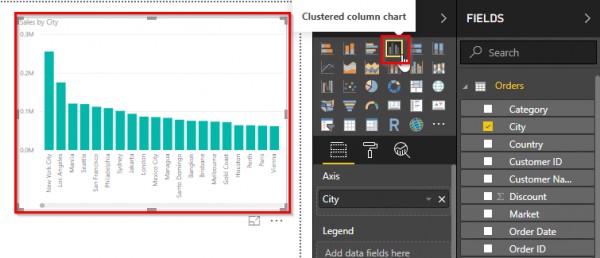
Visualizations can be created in two different ways in Power BI Desktop
- You can directly drag the type of visual on the report section depending upon the type of data

- Select your fields from the set of data> click on the visual from the visualization panel

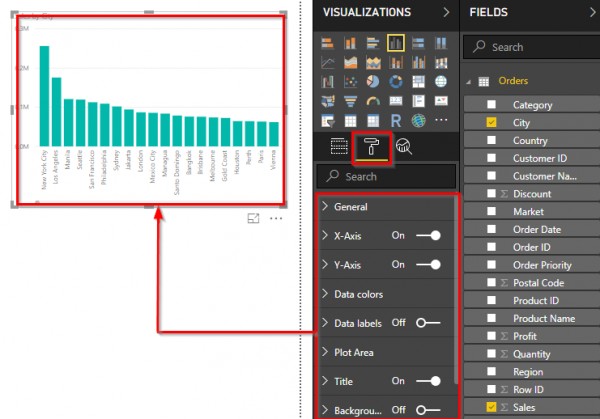
Once the visual has been created, it can now be customised accordingly ie. You can make changes in formats, fonts and alignment.

 REGISTER FOR FREE WEBINAR
X
 Thank you for registering
Join Edureka Meetup community for 100+ Free Webinars each month
JOIN MEETUP GROUP