How to add legend or any text on the map in leaflet

0 votes
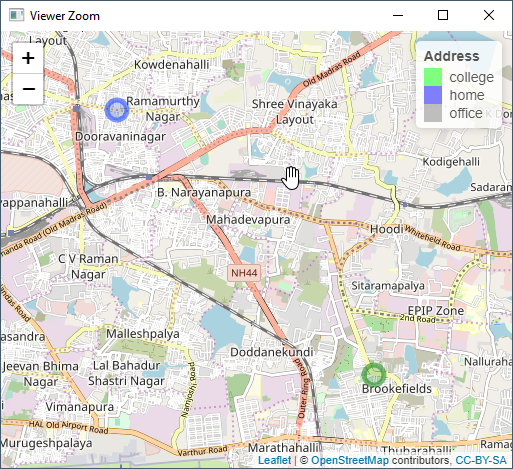
I'm new to leaflet and working on leaflet. I want to add legend or a text indicating which color and popup labels on the top right corner of the screen. Can anyone help me?
Sep 18, 2019 in Data Analytics by anonymous
• 33,030 points
8,911 views

1 answer to this question.

0 votes

See below example,

> p = colorFactor(palette = c("white","green","blue"),domain = c("Office","college","home"),ordered = T)
> my_adds <- leaflet() %>% addTiles() %>% addCircleMarkers(lng=75.6944, lat=11.9811,popup = "My Office",color = "white") %>% addCircleMarkers(lng=77.7141, lat=12.9675,popup = "My college",color = "green") %>% addCircleMarkers(lng=77.669907, lat=13.0118285,popup = "My Home") %>% addLegend(position = "topright",pal = p, values = c("office","home","college"),title = "Address")
> my_adds
answered Oct 28, 2019 by anonymous
• 33,030 points

Related Questions In Data Analytics

0 votes
1 answer

How to add only label or popup withpout markers in a map?

Hi, @ch Use addLabelOnlyMarkers( ) to add labels ...READ MORE

answered Sep 23, 2019 in Data Analytics by anonymous
• 3,450 points
3,168 views
0 votes
1 answer

How to convert a text mining termDocumentMatrix into excel or csv in R?

By assuming that all the values are ...READ MORE

answered Apr 5, 2018 in Data Analytics by DeepCoder786
• 1,720 points
1,920 views
0 votes
0 answers

How to add color legend for box plots in R?

How to add color legend for box ...READ MORE

Jul 4, 2019 in Data Analytics by keerthi
1,588 views
0 votes
0 answers

Any suggestions on how to perform multivariate analysis of fields in R using plots?

Any suggestions on how to perform multivariate ...READ MORE

Jul 22, 2019 in Data Analytics by sindhu
649 views
0 votes
1 answer

plot map points from a dataframe

Hi Peter, Use below code. leaflet(df) %>% addTiles() %>% ...READ MORE

answered Sep 17, 2019 in Data Analytics by priya
921 views
0 votes
1 answer

How to add external markers in maps?

Use external markers by creating icons using ...READ MORE

answered Oct 14, 2019 in Data Analytics by Cherukuri
• 33,030 points
907 views
0 votes
0 answers

fix the map area using leaflet and use ggplot

I created a map using leaflet and ...READ MORE

Sep 18, 2019 in Data Analytics by anonymous
• 33,030 points
664 views
0 votes
1 answer

How to save leaflet object as an image?

Yes, you can save leaflet objects as ...READ MORE

answered Oct 28, 2019 in Data Analytics by Cherukuri
• 33,030 points
5,505 views
0 votes
1 answer

Add buttons to perform actions on the leaflet map.

@ch, You can add easy buttons to add ...READ MORE

answered Oct 14, 2019 in Data Analytics by Cherukuri
• 33,030 points
4,832 views
0 votes
1 answer

How to change the datatype of any field in an external dataset in R?

Hi Anand, Try as below - class(dataset/dataframe$col_name) <- ...READ MORE

answered Jun 28, 2019 in Data Analytics by anonymous
• 33,030 points
764 views
webinar REGISTER FOR FREE WEBINAR X
REGISTER NOW
webinar_success Thank you for registering Join Edureka Meetup community for 100+ Free Webinars each month JOIN MEETUP GROUP