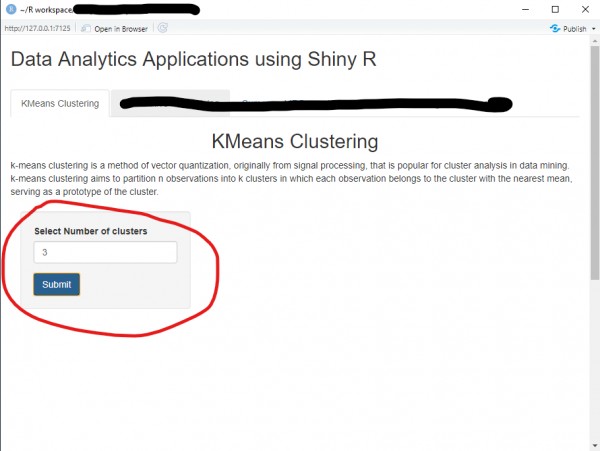
I created a ashiny app weeks back, it was working fine and showing all graphs in the app, But now it isn't showing any outputs. What to do?
Code i used in ui and server -
tabPanel("KMeans Clustering",
         h2("KMeans Clustering",align = "center"),
         kmeans_def,br(),br(),
         sidebarPanel(numericInput("noc",label = "Select Number of clusters", min = 2, max = 5, value = 3),submitButton("Submit")),
         mainPanel(plotOutput("plot"),plotOutput("ggplot")
         ))

# KMeans ------------------------------------------------------------------
km = reactive({ kmeans(mpg[8:9],input$noc) })
output$plot = renderPlot({ plot(mpg$cty,mpg$hwy, col = km()$cluster, main = "Kmeans by plot") })
output$ggplot = renderPlot({ ggplot(mpg, aes(cty,hwy,col= km()$cluster, size = 1)) + geom_point() + theme_bw() + ggtitle("KMeans by GGplot2") + theme(legend.position = "none") })

 REGISTER FOR FREE WEBINAR
X
 Thank you for registering
Join Edureka Meetup community for 100+ Free Webinars each month
JOIN MEETUP GROUP