Stacked and a independent column chart in power BI

+1 vote
Hi, can anyone help how to create a stacked and an independent column chart?

I want to show options other than female and male gender in a stacked chart and female and male gender as individual columns.

Can someone help?
Jun 12, 2019 in Power BI by rahul
10,314 views

1 answer to this question.

+1 vote

Hi Rahul,

Follow the below steps:

1. Create a group with the elements that you need in the stacked column.

Right click on the column and click New Group.
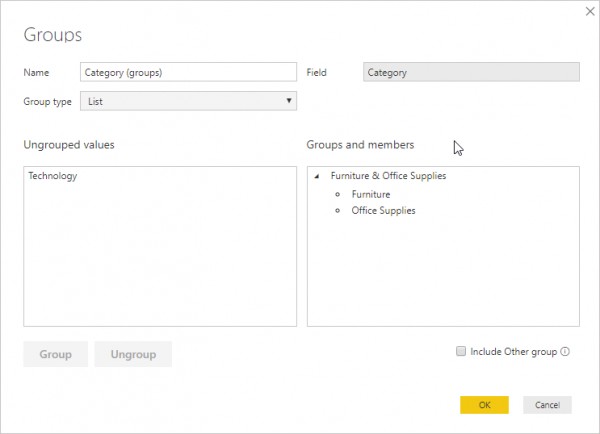
Select the values in field and click on Group. Click ok.

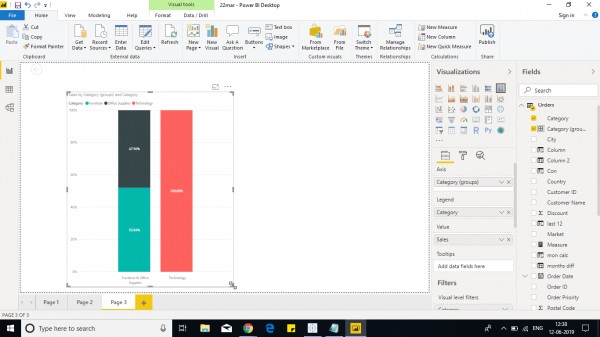
2. Place the created group column in Axis and measure or aggregated column in Values.

3. Drop the column in legend and select vertically stacked column chart.

You can see a stacked column and other individual columns.

Example- 
Hope it helps!.

If you wish to master Power BI Concepts, check out Power BI Course Topics now!.

answered Jun 12, 2019 by anonymous
• 33,030 points
Hi,

I need to build the exact chart displayed in your post but I'm not able to group two of the columns that need to be stacked.  Under 'Ungrouped values', instead of showing other fields available in my table, it displays the values from the fields. How did you create the category "Furniture & Office Supplies" under the 'Groups and members' section?

Thank you.

Hi,

You need to group the columns that you want to add as a stacked column and the others add them as separate groups with independent values.

Groups:

Furniture & Office supplies - > Furniture, Office supplies

Technology -> Technology

If possible, can you share a pic of how far you have done? 

I can help you better then.

Hi,

Thank you for your reply :)

I have three columns, CostClaimed, CostApproved & CostForecastApproved.  All three fields are data type Decimal Number.  The two columns I need to group are CostApproved ad CostForecastApproved with CostClaimed being a single column to the right.

I've tried to put everything into on snippet for you.

Thanks again for your reply.

The above solution is to group column values into independent and stacked columns, not different columns to independent and stacked bar chart.

Related Questions In Power BI

0 votes
1 answer

Creating a stacked chart from 1 column in Power BI

Hi @Veronicabello, Follow the below steps: 1. Create a ...READ MORE

answered Aug 3, 2020 in Power BI by Reshma
1,993 views
+1 vote
1 answer

Have column with multiple values in powerBI, for use with a slicer in power bi

It can be achieved depending on the result you ...READ MORE

answered Oct 22, 2018 in Power BI by Hannah
• 18,520 points
7,456 views
0 votes
1 answer

How to rename a column using DAX in Power BI?

Hi Ramya, I found these two function that ...READ MORE

answered Aug 22, 2019 in Power BI by anonymous
• 33,030 points

edited Dec 31, 2021 by Soumya 36,994 views
0 votes
0 answers

Creating Stacked Column Chart without unpivot of data in Power Query

h READ MORE

Jan 21, 2020 in Power BI by Prakash
• 140 points

closed Mar 24, 2020 by Sirajul 900 views
0 votes
1 answer

Displaying Table Schema using Power BI with Azure IoT Hub

Answering your first question, Event Hubs are ...READ MORE

answered Aug 1, 2018 in IoT (Internet of Things) by nirvana
• 3,130 points
1,317 views
+1 vote
1 answer

Unable to install connector for Power Bi and PostgreSQL

I think the problem is not at ...READ MORE

answered Aug 22, 2018 in Power BI by nirvana
• 3,130 points
2,729 views
+2 votes
2 answers

Migrate power bi collection to power bi embedded

I agree with Kalgi, this method is ...READ MORE

answered Oct 11, 2018 in Power BI by Hannah
• 18,520 points
1,498 views
+1 vote
1 answer

Connect power bi desktop to dataset and create custom reports

Yes using Power BI REST API to ...READ MORE

answered Sep 18, 2018 in Power BI by Kalgi
• 52,350 points
1,650 views
0 votes
1 answer

Chart with only some values in field in a graph in power BI?

Hi Banu, While creating a chart, put the ...READ MORE

answered Apr 10, 2019 in Power BI by Cherukuri
• 33,030 points
964 views
0 votes
1 answer

Difference between measure and calculate column in power BI

Hi Rahul,  With calculated columns, you can add new ...READ MORE

answered May 17, 2019 in Power BI by Cherukuri
• 33,030 points
10,680 views
webinar REGISTER FOR FREE WEBINAR X
REGISTER NOW
webinar_success Thank you for registering Join Edureka Meetup community for 100+ Free Webinars each month JOIN MEETUP GROUP