Hi Sindhu,
Follow the below steps:
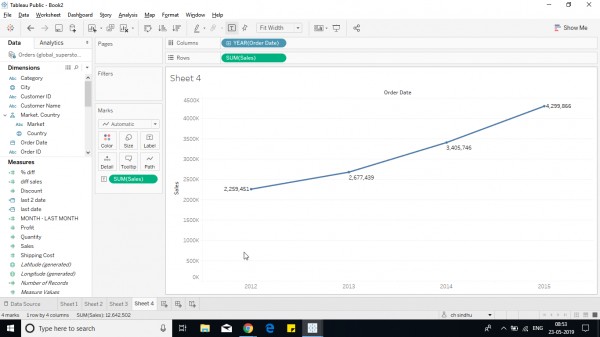
1. Create a line chart with the required dimension/measures.
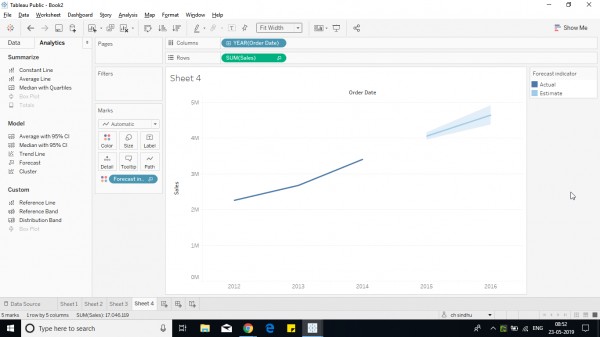
2. Create a forecast.
View below solution to create a simple forecast.
https://www.edureka.co/community/44161/forecast-tableau?show=44161#q44161

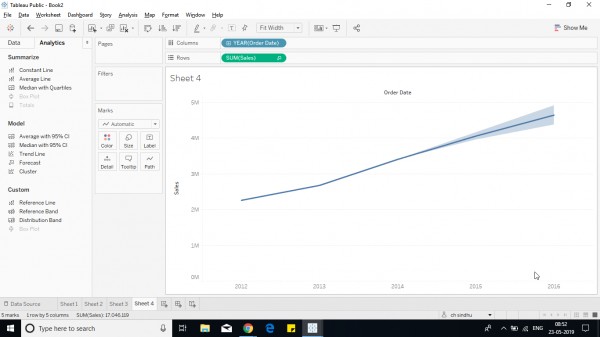
3. Not remove the forecast from the color shelf and add labels.

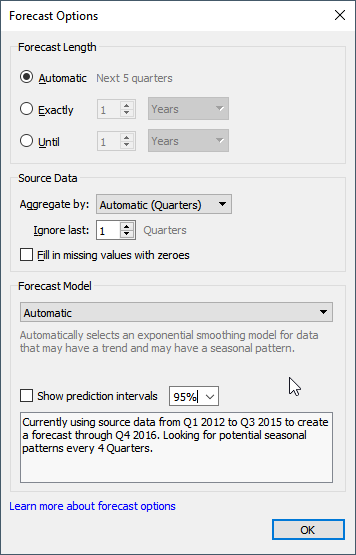
4. Edit the forecast by right-clicking on the line and Go to forecast and then click on Forecast options, Edit the number of periods and prediction interval, and unselect Show prediction levels and click ok.

5. 
Hope it helps.
 REGISTER FOR FREE WEBINAR
X
 Thank you for registering
Join Edureka Meetup community for 100+ Free Webinars each month
JOIN MEETUP GROUP