library(ggplot2)
p <- data.frame(Day=c("2011-04-11", "2014-05-24","2004-01-12","2014-06-20","2010-08-07","2014-05-28"), Impressions=c(24010,15959,16107,21792,24933,21634),Clicks=c(211,106,248,196,160,241))
p
Day Impressions Clicks
1 2011-04-11 24010 211
2 2014-05-24 15959 106
3 2004-01-12 16107 248
4 2014-06-20 21792 196
5 2010-08-07 24933 160
6 2014-05-28 21634 241
p$Day <- strptime(p$Day,"%Y-%m-%d") #formatting into Date
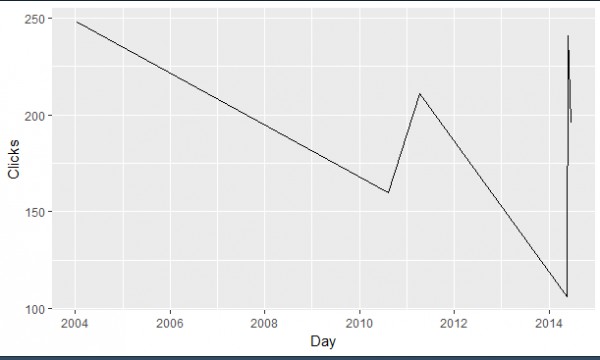
q <- ggplot(p, aes(x=Day,y=Clicks)) + geom_line()
q

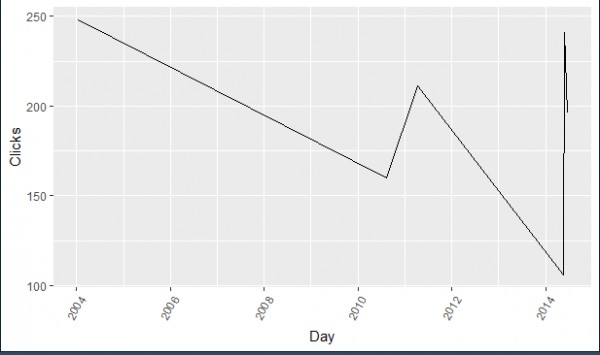
q + theme(axis.text.x = element_text(angle = 60, hjust = 1))

Thus, you can rotate labels for both X and Y axis in the similar way.
 REGISTER FOR FREE WEBINAR
X
 Thank you for registering
Join Edureka Meetup community for 100+ Free Webinars each month
JOIN MEETUP GROUP