Hi Anshuli,
Follow below steps:
1. Create a parameter for the dimension used for making partition.
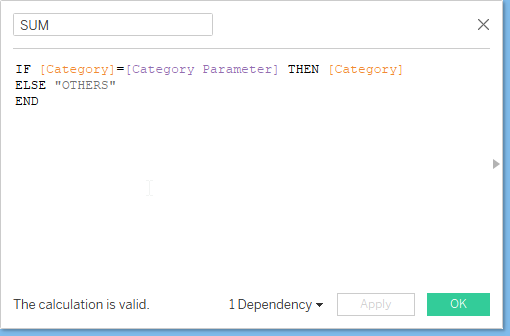
2. Create calculated field to create groups of category vs others.
IF [Category]=[Category Parameter] THEN [Category]
ELSE "OTHERS"
END
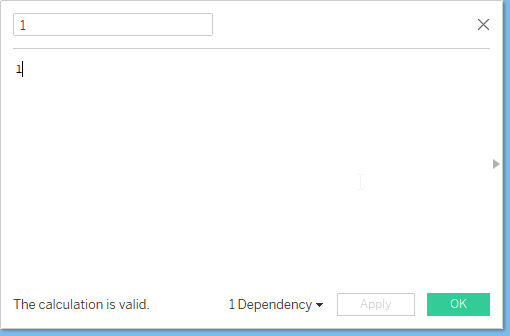
3. Now create another calculated field with value as 1.
4, Add the measure with aggregation.
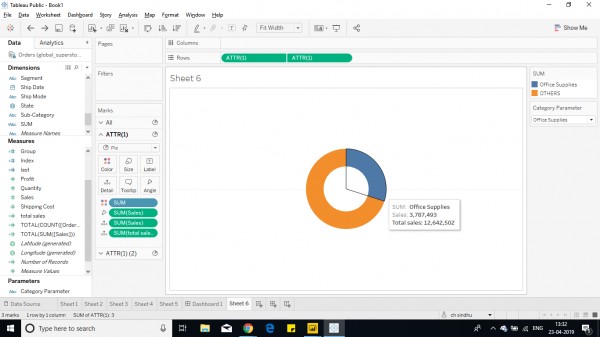
5. Add the created group in steps 2 in color shelf. (similar to below)
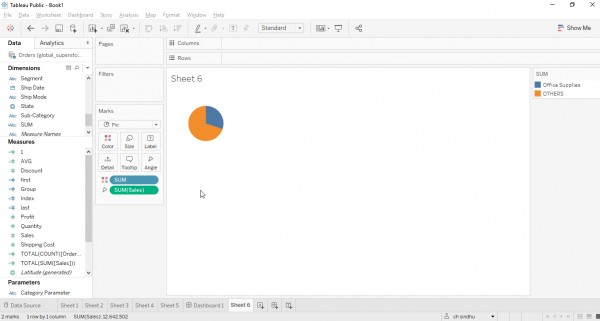
6. Add field 1 in row shelf as below.
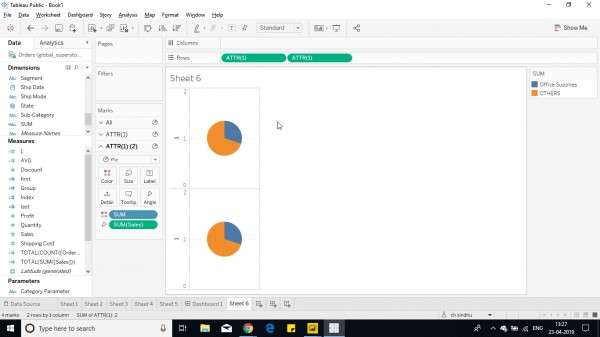
7. Make a dual axis chart and edit the size of 2nd pie into white and remove all fields from its shelves.
8. You finally get the donut chart with selected category wrt others.
Hope this helps you.
 REGISTER FOR FREE WEBINAR
X
 Thank you for registering
Join Edureka Meetup community for 100+ Free Webinars each month
JOIN MEETUP GROUP