Hi Sindhu,
Follow below steps :
1. Select fields total games and game won in row shelf. Now select team name/id and drop it in column shelf.
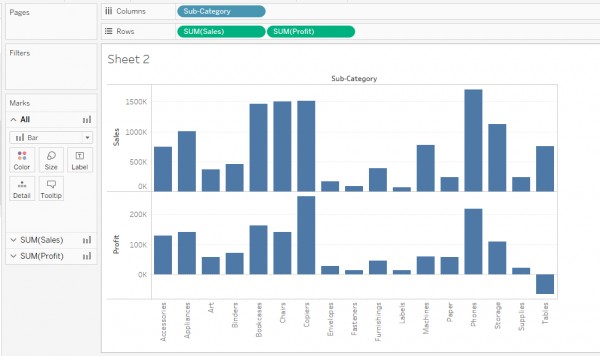
2. Then two bar chart would be shown similar to this.

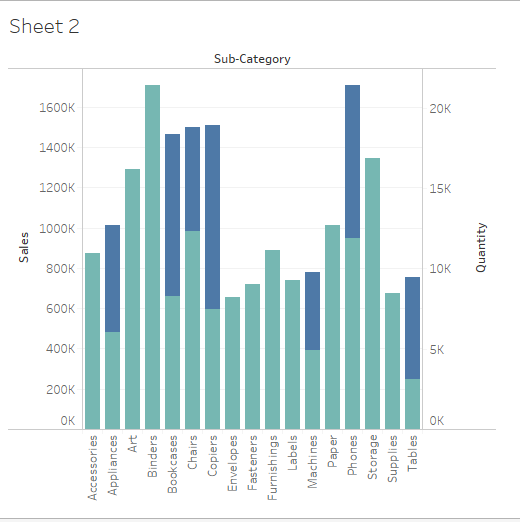
3. Now right click on games won and select dual axis. A chart similar to this is created.

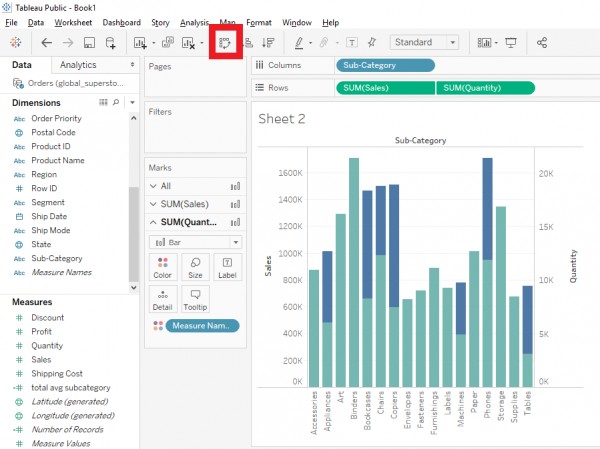
You can also switch the axis by clicking on icon shown below.

4. Now you can change color and edit the size of bar for showing games won bar and total bar.
Hope this helps you.
 REGISTER FOR FREE WEBINAR
X
 Thank you for registering
Join Edureka Meetup community for 100+ Free Webinars each month
JOIN MEETUP GROUP