Tableau - Funnel chart

0 votes
How to create a funnel chart in Tableau?
Mar 26, 2019 in Tableau by Anitha
1,608 views

1 answer to this question.

0 votes

Hi,

Funnel chart is normally used in sales or to track control over leads for marketing/sales companies.

Follow these steps to create a simple funnel chart:

For suppose if you want to show the leads for a company product.

1. Select the phases and the number of leads and make a bar graph.
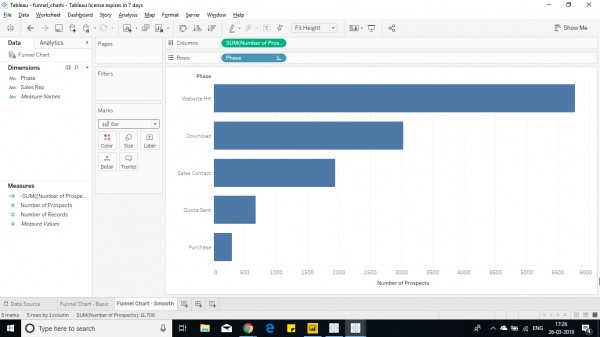
2. Sort the phases as per requirement (for ex: marketing->sales->customer)

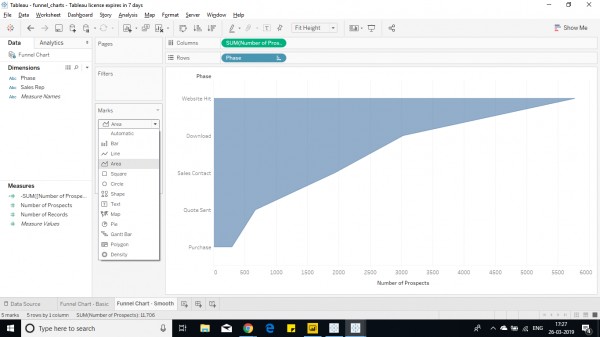
3. Convert the bar to area chart from marks pane.
4. Now Create calculated field as - number of leads/visitors.

5. Drop the field into shelf to make it symmetric.
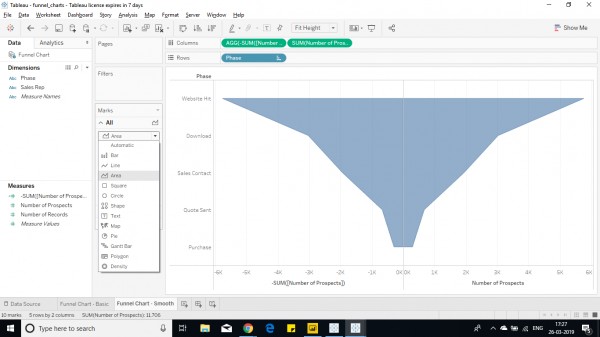
6. Now add the labels and format the graph as per requirement.

Hope this help you.

answered Mar 26, 2019 by Cherukuri
• 33,030 points

Related Questions In Tableau

0 votes
1 answer

Creating a dual axis chart with same measure in Tableau

Yes, this is possible. Drop the measure in ...READ MORE

answered May 29, 2018 in Tableau by Atul
• 10,240 points
8,847 views
0 votes
1 answer

Tableau chart with mixed colors

It is as simple as dragging the ...READ MORE

answered Jun 28, 2018 in Tableau by ffdfd
• 5,550 points
2,005 views
+1 vote
1 answer

Non-overlaid measures in dual axis chart within Tableau

The missing step is to specify the ...READ MORE

answered Jul 24, 2018 in Tableau by Atul
• 10,240 points
927 views
0 votes
1 answer

How to color code cells of a column based on the text value in Tableau

You can use the following steps to ...READ MORE

answered Mar 27, 2018 in Tableau by Atul
• 10,240 points
10,054 views
+2 votes
1 answer
0 votes
1 answer

Calculated filed with if-then

Below is the required code:  IF (NOT ISNULL([test2])) ...READ MORE

answered Mar 27, 2018 in Tableau by Atul
• 10,240 points
1,664 views
+2 votes
1 answer
0 votes
1 answer

funnel chart - color for each stage - Tableau

Hi Riya, Read this for creating a funnel ...READ MORE

answered Apr 30, 2019 in Tableau by Cherukuri
• 33,030 points
1,423 views
0 votes
1 answer

Displaying Aggregations across bar chart in Tableau

Hi Sindhu, 1.You can use average lines to ...READ MORE

answered Mar 8, 2019 in Tableau by Cherukuri
• 33,030 points
2,191 views
webinar REGISTER FOR FREE WEBINAR X
REGISTER NOW
webinar_success Thank you for registering Join Edureka Meetup community for 100+ Free Webinars each month JOIN MEETUP GROUP