Tableau- Pie Chart with Multiple Measure Values

0 votes
How to show multiple measures using pie chart? how to show  % of total in pie chart?
Mar 11, 2019 in Tableau by Nithin
21,382 views

1 answer to this question.

0 votes

Hi Nithin,

Pie chart is used to show comparison of single vs total entity. Pie chart is best to denote at the highest composite form of a field. As the measures increases, the chart becomes unclear to understand.

1. Select the measure/dimension you want to plot the chart. Click on show me and select the pie chart.
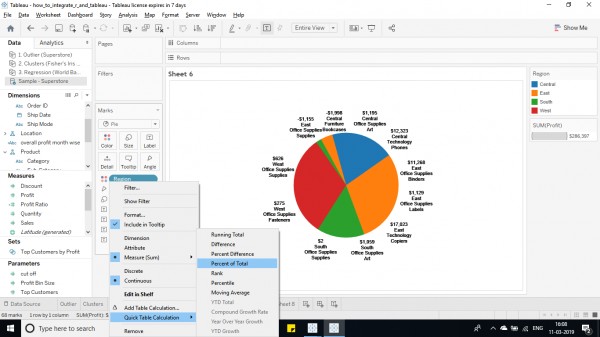
2. Right click on the field and click on quick table calculation and select percent of total.
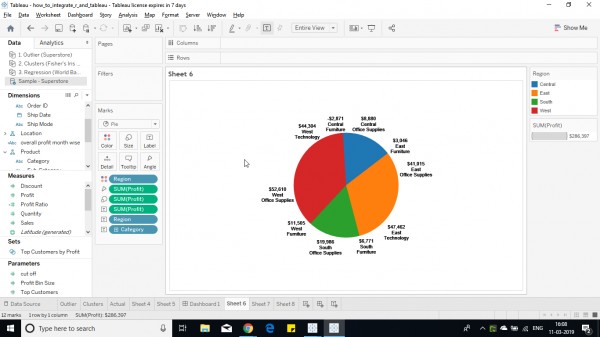
3. After applying quick calculation on field.
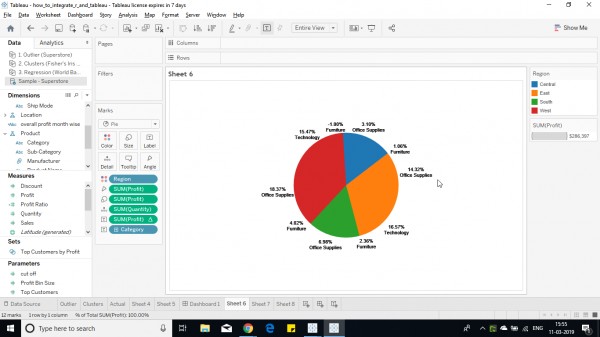
Hope this helps you.

For an in-depth explanation check out Tableau Training Course details.


answered Mar 11, 2019 by Cherukuri
• 33,030 points

Related Questions In Tableau

0 votes
1 answer
0 votes
1 answer

Creating a dual axis chart with same measure in Tableau

Yes, this is possible. Drop the measure in ...READ MORE

answered May 29, 2018 in Tableau by Atul
• 10,240 points
8,847 views
0 votes
1 answer

How to get multiple Sets of Measure Names with different Filters on a single sheet in Tableau?

The easiest solution to your query is: 1) ...READ MORE

answered Aug 23, 2018 in Tableau by Naruto
• 710 points
15,417 views
0 votes
1 answer

creating a tableau pie chart with no measures data

It's not difficult once you understand the ...READ MORE

answered Apr 12, 2022 in Tableau by Neha
• 9,020 points
1,034 views
0 votes
1 answer

How to show percentages on the slices in pie chart in Tableau?

Hi sindhu, You can manually move the labels ...READ MORE

answered Mar 13, 2019 in Tableau by Cherukuri
• 33,030 points
11,894 views
0 votes
1 answer

Display Percentage in a Row in Tableau

Hi Sindhu, You can follow below steps: 1. Create ...READ MORE

answered Mar 13, 2019 in Tableau by Cherukuri
• 33,030 points
15,979 views
0 votes
1 answer

How to calculate work done for a given date or period of time?

Hi, Follow these steps: As per you question since ...READ MORE

answered Apr 1, 2019 in Tableau by Cherukuri
• 33,030 points
1,012 views
0 votes
1 answer

A double pie chart - Pie chart within another pie chart.

Hi sindhu, Follow below steps: 1. Plot a pie ...READ MORE

answered Apr 3, 2019 in Tableau by Cherukuri
• 33,030 points
759 views
0 votes
1 answer

Filter via cell with multiple values

Hi, you can use string pattern matching ...READ MORE

answered Mar 4, 2019 in Tableau by Cherukuri
• 33,030 points
1,039 views
0 votes
1 answer

Rank measure values and show percentage of measures in Tableau

Hi Sindhu, 1. First create a table with ...READ MORE

answered Mar 8, 2019 in Tableau by Cherukuri
• 33,030 points
4,492 views
webinar REGISTER FOR FREE WEBINAR X
REGISTER NOW
webinar_success Thank you for registering Join Edureka Meetup community for 100+ Free Webinars each month JOIN MEETUP GROUP