Hi@akhtar,
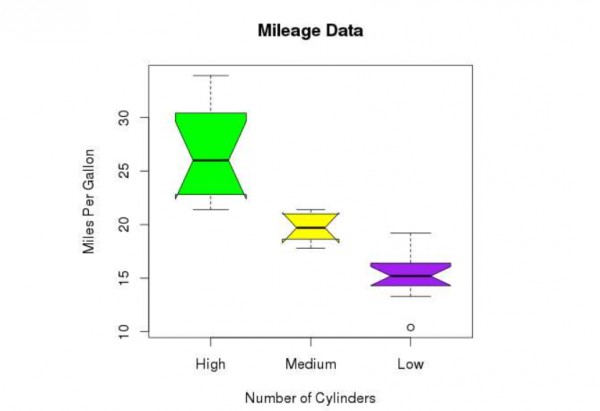
We can draw a boxplot with a notch to find out how the medians of different data groups. The below script will create a boxplot graph with the notch for each of the data groups.
png(file = "boxplot_with_notch.png"
boxplot(mpg ~ cyl, data = mtcars,
   xlab = "Number of Cylinders",
   ylab = "Miles Per Gallon",
   main = "Mileage Data",
   notch = TRUE,
   varwidth = TRUE,
   col = c("green","yellow","purple"),
   names = c("High","Medium","Low")
 REGISTER FOR FREE WEBINAR
X
 Thank you for registering
Join Edureka Meetup community for 100+ Free Webinars each month
JOIN MEETUP GROUP