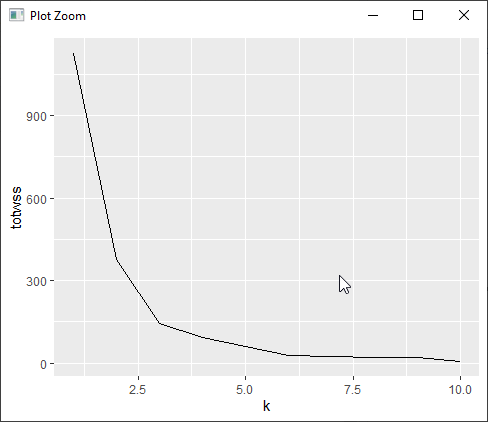
Elbow method allows the user to know the best fit number of clusters.
Follow the below steps:
- Compute clustering algorithm (e.g., k-means clustering) for different values of k. For instance, by varying k from 1 to 10 clusters.
- For each k, calculate the tot.withinss.
- Plot the curve of above values against the number of clusters from step 1.
- The value at the bend of the plot is considered as the best fit value for no of clusters.
totwss=sapply(1:10, function(k) { kmeans(mtcars$mpg,k)$tot.withinss})
k = data.frame(k = 1:6,totwss = totwss)
ggplot(k,aes(k,totwss))+geom_line()

In this case, you can take 2 or 3 as per your choice.
 REGISTER FOR FREE WEBINAR
X
 Thank you for registering
Join Edureka Meetup community for 100+ Free Webinars each month
JOIN MEETUP GROUP