R - Bar chart bivariate multivariate Analysis

0 votes
Help with Bivariate analysis using bar chart. I want to show variations using bar chart.
Aug 21, 2019 in Data Analytics by likith
6,024 views

1 answer to this question.

0 votes

The bivariate analysis could be shown in terns oF stacked bar chart/ column chart/ dual axis bar chart.

1. Stacked bar chart - [ position = "stack"] - show proportion of each independent value of variable.
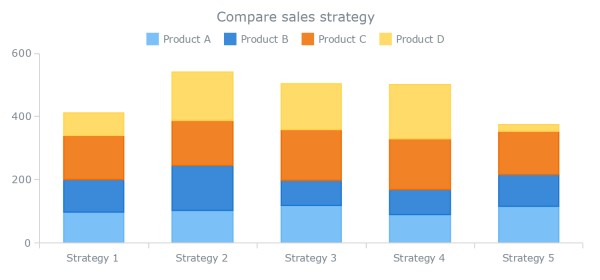
This chart shows 2 variables analysis in 1 axis.

Ex: 

ggplot(mpg, 
       aes(x = class, 
           fill = drv)) + 
  geom_bar(position = "stack") 

or

ggplot(mpg, 
       aes(x = class, 
           fill = drv)) + 
  geom_bar()

2. Side by side bar chart - [ position="dodge" ] - used for comaprison of 2 variables
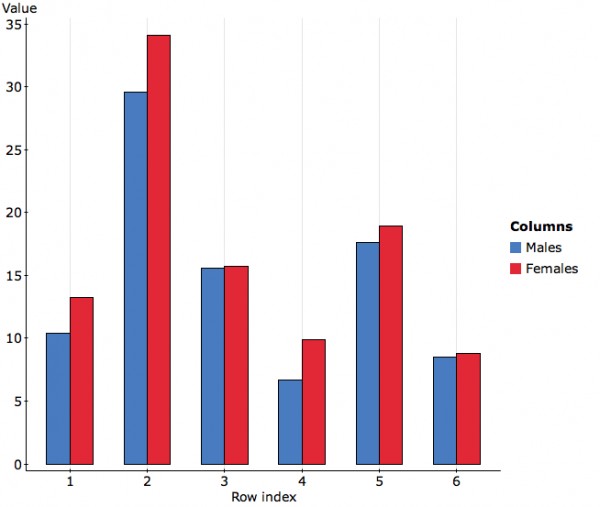
Ex:
ggplot(mpg, 
       aes(x = class, 
           fill = drv)) + 
    geom_bar(position = position_dodge(preserve = "single"))

3. Filled bar chart - [ position="fill" ] - used to show proportion of variables.
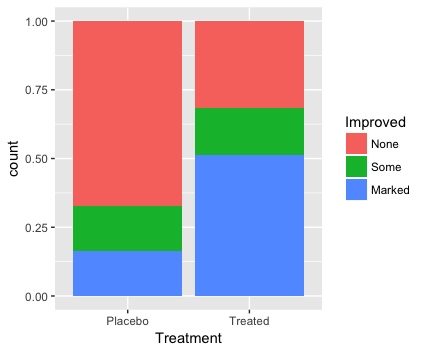
Ex:

ggplot(mpg, 
        aes(x = class, 
            fill = drv)) + 
     geom_bar(position = "fill")

I found the examples and explanation about these examples from here 

Hope it helps!

answered Aug 22, 2019 by anonymous
• 33,030 points

Related Questions In Data Analytics

0 votes
1 answer

Create a dual axis column/bar chart using ggplot in R

Add position = "stack" in geom_bar() function ...READ MORE

answered Nov 4, 2019 in Data Analytics by sindhu
4,709 views
0 votes
0 answers

Any suggestions on how to perform multivariate analysis of fields in R using plots?

Any suggestions on how to perform multivariate ...READ MORE

Jul 22, 2019 in Data Analytics by sindhu
713 views
0 votes
1 answer

Changing the order of bars in a bar-plot - ggplot2 - R

You can use the scale_x_discrete() function with ...READ MORE

answered May 28, 2018 in Data Analytics by Bharani
• 4,660 points
9,769 views
0 votes
1 answer

Showing percentage instead of counts in a bar plot - ggplot2 - R

Load the 'scales' package first, which gives ...READ MORE

answered May 29, 2018 in Data Analytics by Bharani
• 4,660 points
3,917 views
0 votes
1 answer

By using dpylr package sum of multiple columns

Basically here we are making an equation ...READ MORE

answered Apr 5, 2018 in Data Analytics by DeepCoder786
• 1,720 points
2,293 views
0 votes
1 answer

How to convert a text mining termDocumentMatrix into excel or csv in R?

By assuming that all the values are ...READ MORE

answered Apr 5, 2018 in Data Analytics by DeepCoder786
• 1,720 points
2,026 views
0 votes
1 answer

In a dpylr pipline how to use sample and seq?

For avoiding rowwise(), I prefer to use ...READ MORE

answered Apr 6, 2018 in Data Analytics by DeepCoder786
• 1,720 points

edited Jun 9, 2020 by Gitika 1,220 views
0 votes
1 answer

How to create a list of Data frames?

Basically all we have to do is ...READ MORE

answered Apr 9, 2018 in Data Analytics by DeepCoder786
• 1,720 points
1,459 views
0 votes
1 answer

Aggregation of fields vs field value line chart in R

Of course, it can be done. Let ...READ MORE

answered Nov 3, 2019 in Data Analytics by Cherukuri
• 33,030 points
669 views
0 votes
1 answer

R chart using plotly

Plot_ly example library(plotly) today <- Sys.Date() tm <- ...READ MORE

answered Nov 4, 2019 in Data Analytics by Cherukuri
• 33,030 points
1,076 views
webinar REGISTER FOR FREE WEBINAR X
REGISTER NOW
webinar_success Thank you for registering Join Edureka Meetup community for 100+ Free Webinars each month JOIN MEETUP GROUP