@Kruthi,
Refer to this blog on how to create a pie chart, then follow the below steps.
https://www.edureka.co/community/54913/pie-chart-using-ggplot-r?show=54913#q54913
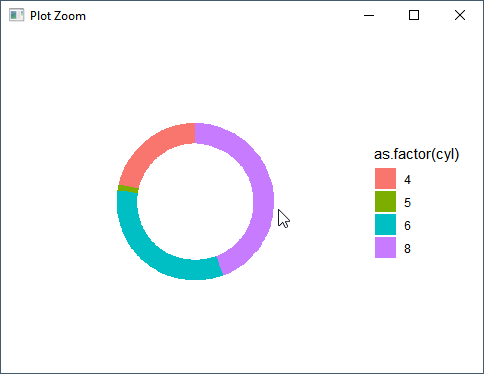
Convert the above used ggplot statement as below -
>ggplot(mpg1,aes(x=3,y=displ,fill=as.factor(cyl)))+geom_bar(stat="identity")+coord_polar("y",start=0)+theme_void()+xlim(1,4)

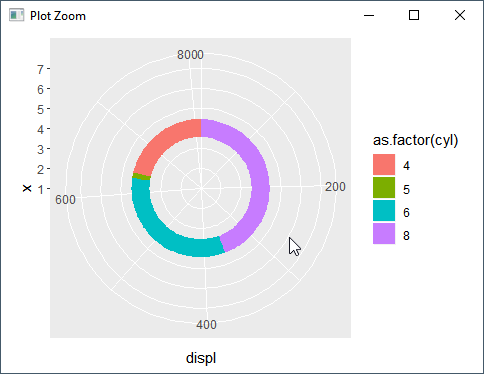
In the above code xlim() zooms into a specified area and x=3 here is the row that is focused on.
See the below code and picture for better clarity.
>ggplot(mpg1,aes(x=4,y=displ,fill=as.factor(cyl)))+geom_bar(stat="identity")+coord_polar("y",start=0)+xlim(1,7)

Hope it helps you.
 REGISTER FOR FREE WEBINAR
X
 Thank you for registering
Join Edureka Meetup community for 100+ Free Webinars each month
JOIN MEETUP GROUP