pie chart using ggplot - R

0 votes
How to draw a pie chart using ggplot? I cant find any pie function for geom_*. Can someone help?
Aug 16, 2019 in Data Analytics by nikitha
2,677 views

1 answer to this question.

0 votes

Hi, even I was searching for this answer, I found the way later.

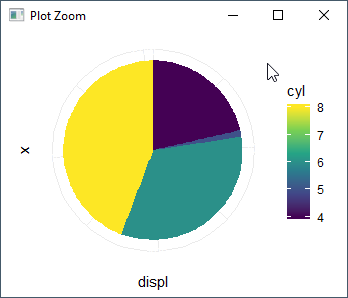
You need to use geom_bar and then later convert it to polar coordinates to get a pie chart.

Let me show an example,

mpg1 = mpg %>% arrange(cyl)

ggplot(mpg1,aes(x="",y=displ,fill = cyl))+geom_bar(stat = "identity")+coord_polar("y",start=0)+scale_fill_continuous(type = "viridis")+theme_minimal()+theme(axis.text = element_text(color = "white"))
answered Aug 19, 2019 by anonymous
• 33,030 points

Related Questions In Data Analytics

0 votes
1 answer

Create a dual axis column/bar chart using ggplot in R

Add position = "stack" in geom_bar() function ...READ MORE

answered Nov 4, 2019 in Data Analytics by sindhu
4,709 views
+2 votes
1 answer

R programming: Drawing an xbar and R chart using qcc package

Try this: #x-Bar library(qcc) x=c(1080͵ 1390͵ 1460͵ ...READ MORE

answered Jan 25, 2019 in Data Analytics by Tyrion anex
• 8,700 points
1,597 views
0 votes
0 answers

Edit date values in ggplot line chart -R

Hi, I want to edit the data ...READ MORE

Jul 25, 2019 in Data Analytics by rekha
517 views
0 votes
1 answer

Waterfall chart using plotly in R

A simple waterfall chart using plotly - df ...READ MORE

answered Nov 2, 2019 in Data Analytics by Cherukuri
• 33,030 points
2,975 views
0 votes
1 answer

How to plot side-by-side Plots with ggplot2 in R?

By Using gridExtra library we can easily ...READ MORE

answered Apr 16, 2018 in Data Analytics by DeepCoder786
• 1,720 points

edited Jun 9, 2020 by MD 8,927 views
+1 vote
1 answer

How to change fill color in each facet using ggplot2?

You can map the facetting variable to ...READ MORE

answered May 8, 2018 in Data Analytics by kappa3010
• 2,090 points
25,610 views
0 votes
11 answers

Changing the legend title in ggplot

Hi, you can also try guides() to ...READ MORE

answered Jul 30, 2019 in Data Analytics by Cherukuri
• 33,030 points
17,834 views
0 votes
1 answer

How to order bars in a bar graph using ggplot2?

The key to ordering is to set ...READ MORE

answered Jun 1, 2018 in Data Analytics by DataKing99
• 8,250 points
1,247 views
0 votes
1 answer

How to edit the labels and limit if a plot using ggplot? - R

Add a limit to axis ticks using ...READ MORE

answered Nov 3, 2019 in Data Analytics by anonymous
• 33,030 points
750 views
0 votes
1 answer

R chart using plotly

Plot_ly example library(plotly) today <- Sys.Date() tm <- ...READ MORE

answered Nov 4, 2019 in Data Analytics by Cherukuri
• 33,030 points
1,076 views
webinar REGISTER FOR FREE WEBINAR X
REGISTER NOW
webinar_success Thank you for registering Join Edureka Meetup community for 100+ Free Webinars each month JOIN MEETUP GROUP