Selecting based on filters

+1 vote

Hi,

For below data

OrderID Value Above 100
1 110 Yes
2 90 No
3 150 Yes

1. How can select create a measure selecting only "Yes"

OR

2. I need data where Above 100 is "Yes"

Aug 12, 2019 in Power BI by anonymous
• 230 points
912 views

1 answer to this question.

+1 vote

Hi, 

If you have more than one table or visual on the same page, then do not use a slicer for filtering, else use a slicer.

1. Create a table with OrderId and Value fields. 

2.  If more than one visual or table is on the page, then Next drop the Above 100 field in visual level filters shelf as shown below and go to basic filtering then select yes, 
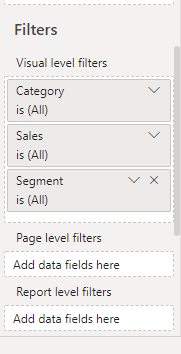
else create a slicer from visualizations pane with Above 100 field.

Hope it helps!

answered Aug 12, 2019 by anonymous
• 33,030 points
Thanks for the response.

Forgot to mention that I have relationship built with another table and when I select this slicer as you mentioned it will affect the 2nd table as well.
Sure. So add the Above field in the visual filter so as to not affect other table or visuals.
So does the solution help your question or any change to your question?
I am using 2 values in one table.

So when I apply above 100 slicer on the visual level filter the other value of also getting impacted.
Add Above a field in visual level filters only and not in the slicer.

If you add Above 100 field in slicer as well as visual level filters then the slicer will affect your table and also the visual filter.

If you have added so then remove the slicer and keep only visual level filter.

Related Questions In Power BI

0 votes
1 answer

How to create summary table based on selected filters/slicers?

Here are the steps you can follow: 1. ...READ MORE

answered Nov 12, 2020 in Power BI by anonymous
• 65,770 points
2,976 views
0 votes
1 answer
0 votes
1 answer

Locating closest match based on Latitude & Longitude

First of all, we need to use the ...READ MORE

answered Jan 2, 2019 in Power BI by Shubham
• 13,490 points
3,176 views
0 votes
1 answer

How do I label bar graph with different colors based on values from different slicers?

If the user selects only one value ...READ MORE

answered May 21, 2019 in Power BI by Avantika
• 1,520 points
1,481 views
0 votes
1 answer

How to show visualization (map) based on latitude and longitude points in power BI?

Follow the below steps: 1. Select the map ...READ MORE

answered Oct 18, 2019 in Power BI by anonymous
• 3,450 points
3,048 views
0 votes
1 answer

last 10 days data based on Date&time

Hi, @Vnk, Regarding your query, you have to ...READ MORE

answered Jun 4, 2020 in Power BI by Gitika
• 65,770 points
3,536 views
0 votes
1 answer

Dynamic title Based on Date

Hi, @Vnk, You can try this: [Date(WindowMax)(Title)] = WINDOW_MAX( ...READ MORE

answered Jun 15, 2020 in Power BI by Gitika
• 65,770 points
1,079 views
0 votes
3 answers

How to create final table based on Joins of two tables in power BI?

To do so, follow these steps: From the ...READ MORE

answered Dec 16, 2020 in Power BI by Gitika
• 65,770 points
55,981 views
0 votes
1 answer

How to add multiple reference lines on a bar/ column graph?

Hi, Follow below steps: 1. Add a bar/ column ...READ MORE

answered Mar 26, 2019 in Power BI by Cherukuri
• 33,030 points
8,782 views
webinar REGISTER FOR FREE WEBINAR X
REGISTER NOW
webinar_success Thank you for registering Join Edureka Meetup community for 100+ Free Webinars each month JOIN MEETUP GROUP