Hi @raghav,
You can draw specific graphs only such as line or segment, bar, etc.
You can draw these using annotate function from the ggplot package.
Let me give you some R codes for such plots
library(ggplot2)

# Rect or bar chart -------------------------------------------------------

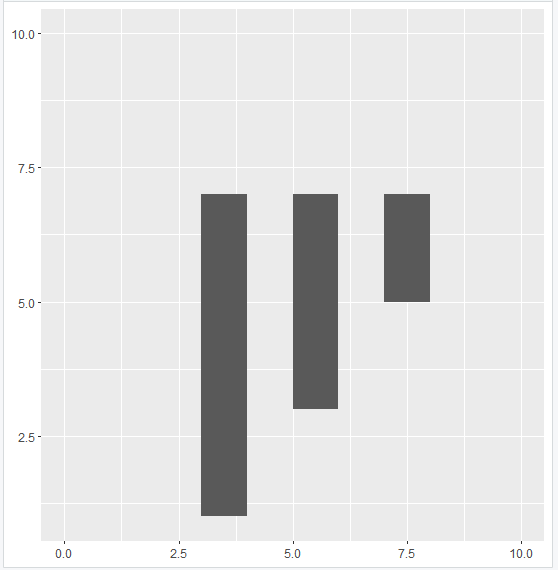
ggplot() + lims(x = c(0,10), y = c(1,10)) + annotate("rect",xmin = 5,xmax = 6, ymax = 7,ymin = 3) +
  annotate("rect",xmin = 3,xmax = 4, ymax = 7,ymin = 1) + annotate("rect",xmin = 7,xmax = 8, ymax = 7,ymin = 5)

# Line or segment ---------------------------------------------------------

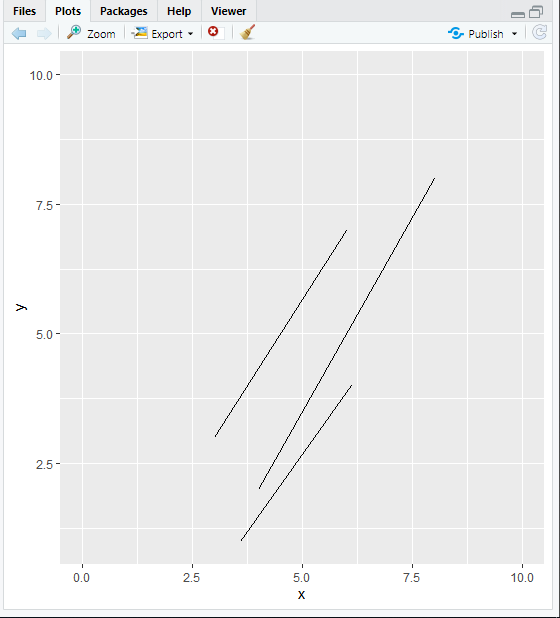
ggplot() + lims(x = c(0,10), y = c(1,10))+ annotate("segment",x = 3,xend = 6, yend = 7,y = 3) +
  annotate("segment",x = 4,xend = 8, yend = 8,y = 2) + annotate("segment",x = 3.6,xend = 6.1, yend = 4,y = 1)

# PointRange --------------------------------------------------------------

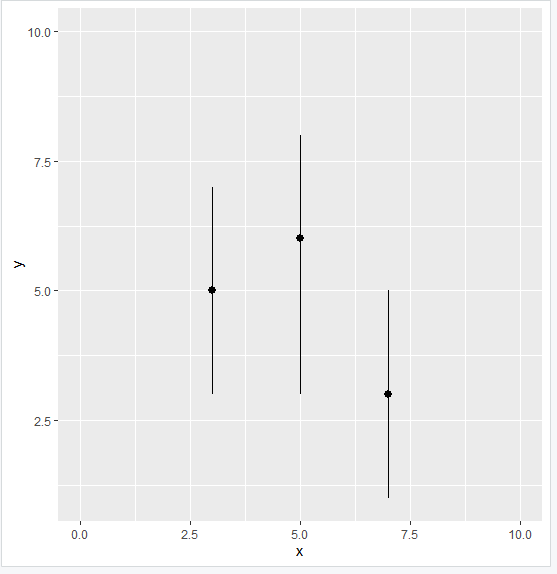
ggplot() + lims(x = c(0,10), y = c(1,10)) + annotate("pointrange", ymax = 7,ymin = 3,x = 3,y = 5) +
  annotate("pointrange", ymax = 8,ymin = 3,x = 5,y = 6) + annotate("pointrange", ymax = 5,ymin = 1,x = 7,y = 3)
Images for above plots


 REGISTER FOR FREE WEBINAR
X
 Thank you for registering
Join Edureka Meetup community for 100+ Free Webinars each month
JOIN MEETUP GROUP