How to put border for all legends together and separate borders for each legend in ggplot

0 votes
How to put border for all legends together and separate borders for each legend in ggplot?
Jul 23, 2019 in Data Analytics by Anitha
5,488 views

1 answer to this question.

0 votes

Hi Anitha,

There are 2 functions used to edit legend and all legends together.

Legend.background / text / title /  direction / position, etc provide design and formating to each legends for all geom_* layers in the plot whereas 

legend.box.background / text / title /  direction / position provides format, edit the legends for all legends together.

An example - 

ggplot(mpg, aes(displ, hwy, col = class)) + geom_point(size = 2,aes(shape = factor(cyl))) + theme(legend.box.background = element_rect(color = "red",fill = "grey"),legend.box.margin = margin(0.4,0.4,0.4,0.4,"cm"),legend.background = element_rect(color = "yellow")) + guides(shape = guide_legend(title = "cyl")) + scale_shape_discrete(labels = c("a","b","c","d")) + theme(legend.position = "bottom", legend.direction = "vertical")

The above code gives the below plot.
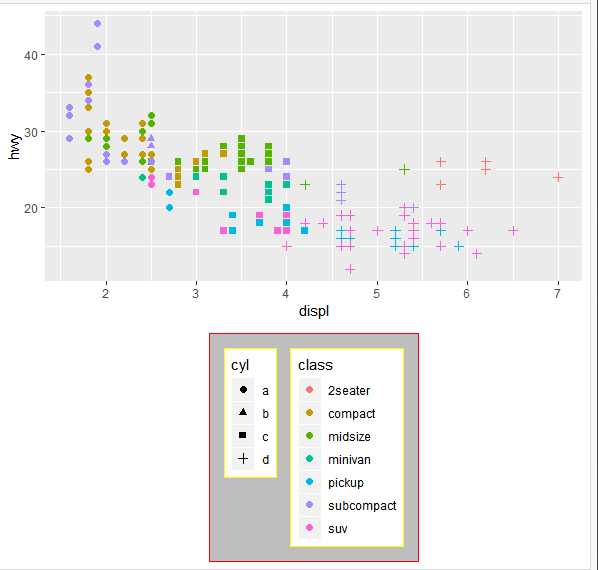
Here legend.key.background provides background color to the container that holds all legends whereas legend.background give color for each legend container.

answered Jul 24, 2019 by Cherukuri
• 33,030 points

Related Questions In Data Analytics

0 votes
0 answers

how to hide and show legends for different geom_plots* in a single ggplot?

how to hide and show legends for ...READ MORE

Jul 23, 2019 in Data Analytics by karthick
887 views
0 votes
0 answers

How to add color legend for box plots in R?

How to add color legend for box ...READ MORE

Jul 4, 2019 in Data Analytics by keerthi
1,660 views
0 votes
1 answer

How do you have 2 different colors in a bar graph, ggplot in where one color for the negatives and positives

Hi@Andris, Once you have the data, you can make the ...READ MORE

answered Oct 5, 2020 in Data Analytics by MD
• 95,460 points
1,172 views
0 votes
1 answer

In a dpylr pipline how to use sample and seq?

For avoiding rowwise(), I prefer to use ...READ MORE

answered Apr 6, 2018 in Data Analytics by DeepCoder786
• 1,720 points

edited Jun 9, 2020 by Gitika 1,220 views
0 votes
1 answer

How to plot side-by-side Plots with ggplot2 in R?

By Using gridExtra library we can easily ...READ MORE

answered Apr 16, 2018 in Data Analytics by DeepCoder786
• 1,720 points

edited Jun 9, 2020 by MD 8,927 views
+1 vote
1 answer

How to change fill color in each facet using ggplot2?

You can map the facetting variable to ...READ MORE

answered May 8, 2018 in Data Analytics by kappa3010
• 2,090 points
25,611 views
0 votes
11 answers

Changing the legend title in ggplot

Hi, you can also try guides() to ...READ MORE

answered Jul 30, 2019 in Data Analytics by Cherukuri
• 33,030 points
17,834 views
0 votes
1 answer

How to order bars in a bar graph using ggplot2?

The key to ordering is to set ...READ MORE

answered Jun 1, 2018 in Data Analytics by DataKing99
• 8,250 points
1,247 views
0 votes
1 answer

How can I add line to show mean for each barplot, not for all dataset?

Hey ranjith,  Use geom_hline() function to add reference lines ...READ MORE

answered Oct 14, 2019 in Data Analytics by Cherukuri
• 33,030 points
639 views
0 votes
1 answer

What is grob and how to create grobs in ggplot?

A grid graphical object (“grob”) is a ...READ MORE

answered Oct 29, 2019 in Data Analytics by Cherukuri
• 33,030 points
6,701 views
webinar REGISTER FOR FREE WEBINAR X
REGISTER NOW
webinar_success Thank you for registering Join Edureka Meetup community for 100+ Free Webinars each month JOIN MEETUP GROUP