Hi priyanka,
Follow the below steps:
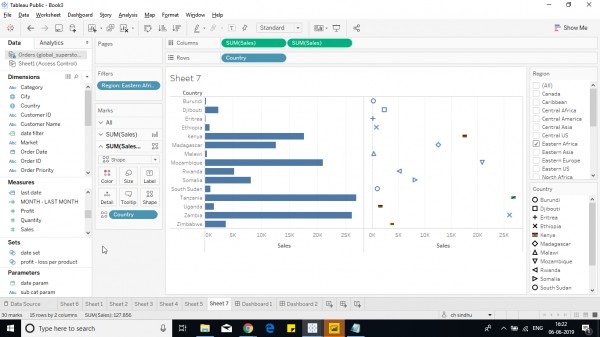
1. Create a bar chart with the country and any measure.
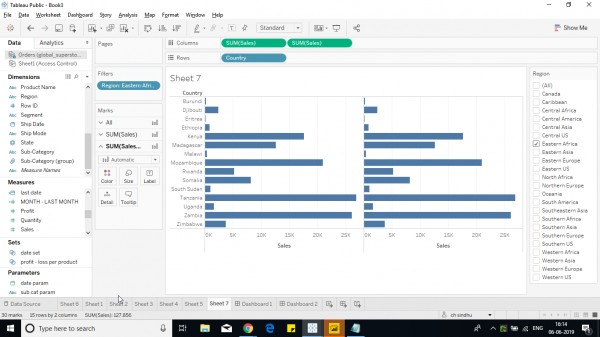
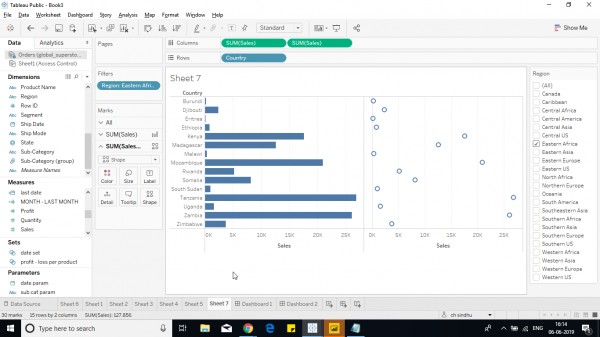
2. Now convert one of the marks to shapes. Drop country in shapes shelf
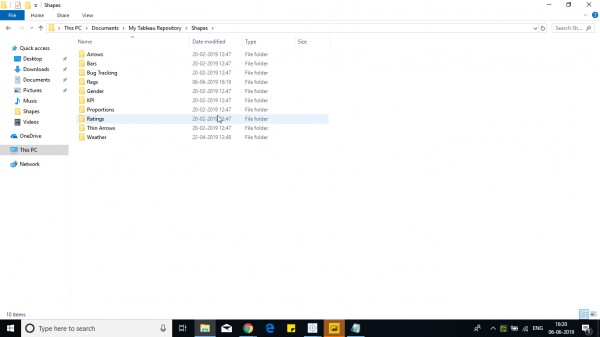
3. Now create a folder with all country flags and add the folder in my tableau repository.
4. Now go to Shapes shelf and click on more shapes andclick on the reload shapes.
5. You can see a list of flags in a folder.
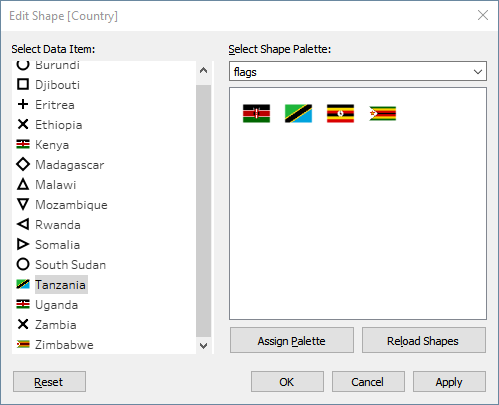
6. Select each flag for each country and click ok.
7. Now make a dual axis chart to get chart. Edit the sixe of shape and bar.
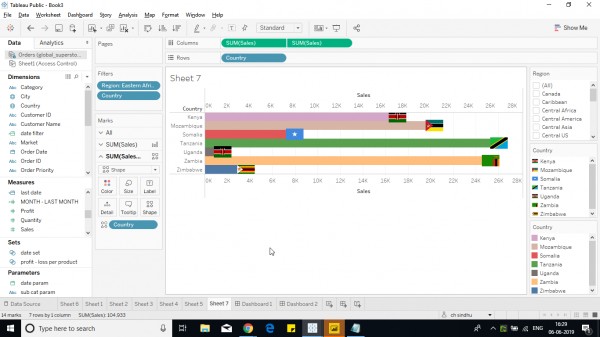
Hope it helps!
 REGISTER FOR FREE WEBINAR
X
 Thank you for registering
Join Edureka Meetup community for 100+ Free Webinars each month
JOIN MEETUP GROUP