Add arrows to show increase or decrease in sales profit

0 votes
How to add arrows and text together to show increase or decrease in sales/profit?
May 16, 2019 in Tableau by priyanka
2,151 views

1 answer to this question.

0 votes

Hi Priyanka,

Follow the below steps:

1. Select the marks pane from Automatic to Shapes.

2. Now create a calculated field to find the difference 

     diff = ZN(SUM([Profit])) - LOOKUP(ZN(SUM([Profit])), -1)

3. Now create a calculated field to group the dimension(orders/regions, etc) into 2 groups as increase and decrease.

    Arrows = IF DIFF> 200 THEN "UP" ELSE "DOWN" END

4. Now add the arrows group in shapes shelf and change the default symbols to arrows by clicking on the shape shelf.
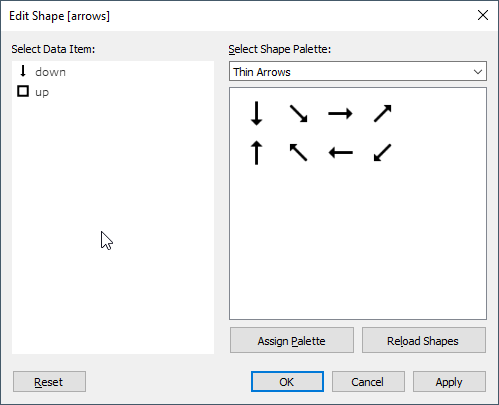
Select Thin arrows in the drop down and select the data item and select the symbol from the symbols on the right side of the window. Then click ok.
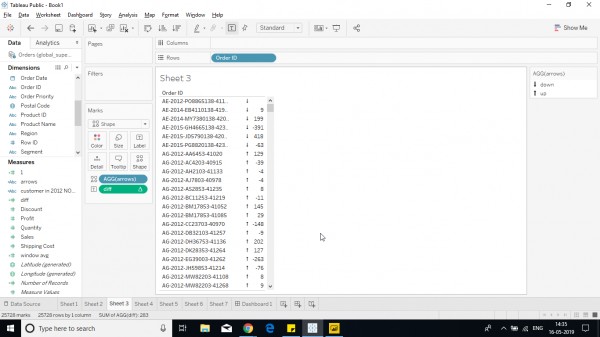
Hope it helps.

answered May 16, 2019 by Cherukuri
• 33,030 points

Related Questions In Tableau

0 votes
1 answer

How to add filter to show latest two dates in tableau?

Steps for filtering based on the most ...READ MORE

answered Jun 21, 2018 in Tableau by Atul
• 10,240 points
2,237 views
0 votes
1 answer

tableau-react problem to show up full screen mode icon in tableau server or tableau public

The tableau-react documentation says that the supported ...READ MORE

answered Mar 14, 2022 in Tableau by Neha
• 9,020 points
767 views
0 votes
1 answer

How to calculate profit when cost and revenue are in same column?

You can create the following calculated fields: Profit: SUM(IIF([account_category] ...READ MORE

answered Apr 10, 2018 in Tableau by ffdfd
• 5,550 points
1,270 views
0 votes
1 answer

How can I add legends to worksheet in Tableau?

Just add the worksheet on the dashboard ...READ MORE

answered Apr 21, 2018 in Tableau by ffdfd
• 5,550 points
6,916 views
0 votes
1 answer

How to color code cells of a column based on the text value in Tableau

You can use the following steps to ...READ MORE

answered Mar 27, 2018 in Tableau by Atul
• 10,240 points
10,055 views
+2 votes
1 answer
0 votes
1 answer

Calculated filed with if-then

Below is the required code:  IF (NOT ISNULL([test2])) ...READ MORE

answered Mar 27, 2018 in Tableau by Atul
• 10,240 points
1,664 views
+2 votes
1 answer
0 votes
1 answer

How to show % difference between bar chart to show increase or decrease?

Hi Anshuli, Make the bar chart first for ...READ MORE

answered Apr 5, 2019 in Tableau by Cherukuri
• 33,030 points
11,084 views
0 votes
1 answer

How to show density map in an area or a custom geological location?

Hi Preethi, Follow the below steps to create ...READ MORE

answered May 9, 2019 in Tableau by Cherukuri
• 33,030 points
602 views
webinar REGISTER FOR FREE WEBINAR X
REGISTER NOW
webinar_success Thank you for registering Join Edureka Meetup community for 100+ Free Webinars each month JOIN MEETUP GROUP