Hi Nikita,
Follow the below steps:
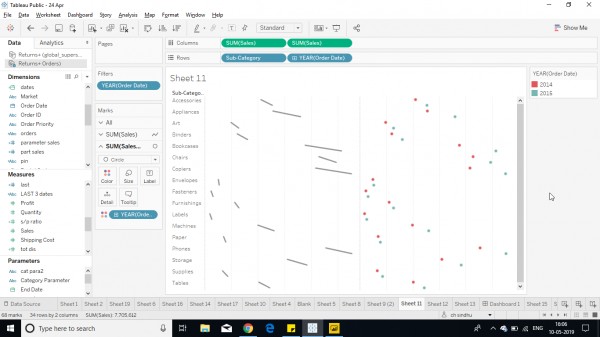
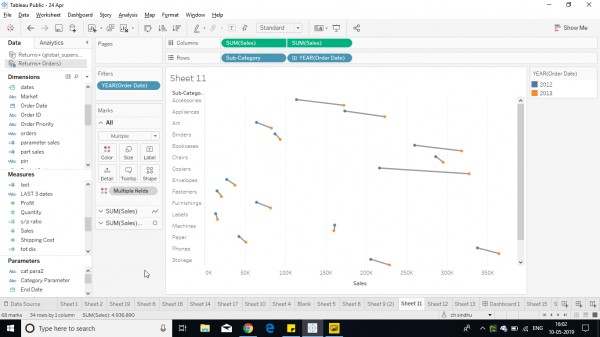
1. Select the dimension sales and subcategory to show the transition in the year 2012-2013
2. Put the years in the filter and select the years wanted.
3. Select the measure again and select different marks.
In above step 2 and 3 select 1 as line and other as circle marks.

4. Now make a dual axis graph to form the dumbbell chart.

Hope it helps you.
 REGISTER FOR FREE WEBINAR
X
 Thank you for registering
Join Edureka Meetup community for 100+ Free Webinars each month
JOIN MEETUP GROUP