How to show data between few points dates measure

0 votes
How to show data between few data points in visual?
Apr 24, 2019 in Tableau by akhil
980 views

1 answer to this question.

0 votes

Hi Akhil,

You can show data values or points between dates or numbers.

To use range of dates, Follow below steps:

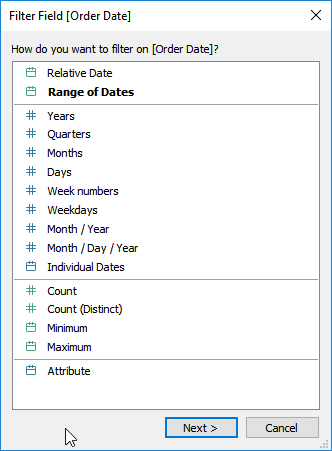
     1. Drag and Drop the date field in Filter shelf.

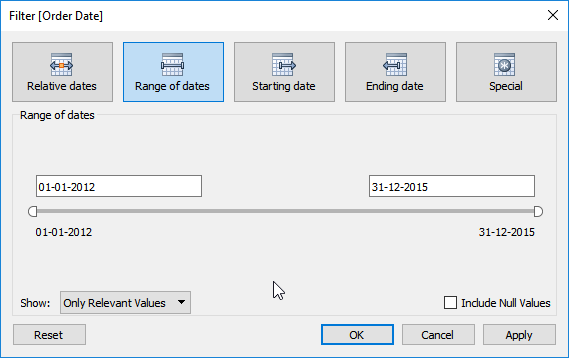
     2. Now select Range of dates from the options. Then below dialog box opens.


       3 .Now select the dates and click ok. To edit the filter latershow the filter so user can also change the range filter.

To Use Number as a range, You can use parameters to and calculative field to show data.

       1. Create 2 parameters to take the upper and lower limit.

       2. Then create a calculated field to fetch the data by using relational operators (<, >, = ) and fetch data.

Hope this helps you.

answered Apr 24, 2019 by Cherukuri
• 33,030 points

Related Questions In Tableau

0 votes
1 answer

How to add filter to show latest two dates in tableau?

Steps for filtering based on the most ...READ MORE

answered Jun 21, 2018 in Tableau by Atul
• 10,240 points
2,237 views
0 votes
1 answer

How to show outliers for a given set of points.

Hi Anshuli, Follow below steps: 1. Create a line ...READ MORE

answered Apr 17, 2019 in Tableau by Cherukuri
• 33,030 points
1,027 views
+2 votes
2 answers

How to calculate Yearly Average when few month data are missing ?

It depends whether you want to skip ...READ MORE

answered Jul 15, 2019 in Tableau by anonymous
• 33,030 points
7,869 views
0 votes
1 answer

How to use tableau to searh for text within entire data

You can use a pivot table in ...READ MORE

answered Apr 4, 2018 in Tableau by xyz
• 1,560 points
863 views
0 votes
1 answer

Reset filters in Tableau

I understood your question (I hope so!). ...READ MORE

answered Mar 30, 2018 in Tableau by QueenBee
• 1,820 points
4,116 views
0 votes
1 answer

How to create a global filter

Assuming you have created a dashboard already, ...READ MORE

answered Apr 13, 2018 in Tableau by QueenBee
• 1,820 points
1,522 views
0 votes
1 answer

How can I create a second sheet which is filtered to 8 days ago,

Following are the steps you can follow: Create ...READ MORE

answered Jul 11, 2018 in Tableau by ffdfd
• 5,550 points
933 views
0 votes
1 answer

How to filter/parameter for different date ranges

Steps: Create a parameter control that the users ...READ MORE

answered Jun 21, 2018 in Tableau by Atul
• 10,240 points
5,114 views
0 votes
1 answer

How to show a chart with only a part of the dimension/measure value.

Hi Nithin, Follow below steps: 1. Create a calculative ...READ MORE

answered Apr 2, 2019 in Tableau by Cherukuri
• 33,030 points
958 views
0 votes
1 answer

How to show % difference between bar chart to show increase or decrease?

Hi Anshuli, Make the bar chart first for ...READ MORE

answered Apr 5, 2019 in Tableau by Cherukuri
• 33,030 points
11,084 views
webinar REGISTER FOR FREE WEBINAR X
REGISTER NOW
webinar_success Thank you for registering Join Edureka Meetup community for 100+ Free Webinars each month JOIN MEETUP GROUP