Hi Sindhu,
You can choose the fields that are not present in the chart or visualization in a sheet or dashboard to apply filters too.
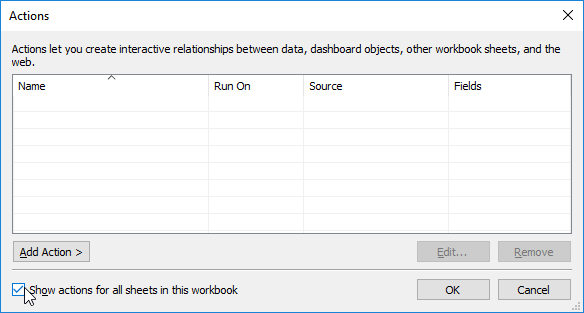
1. Go to the respective Sheet/Dashboard and go to Actions dialog box.
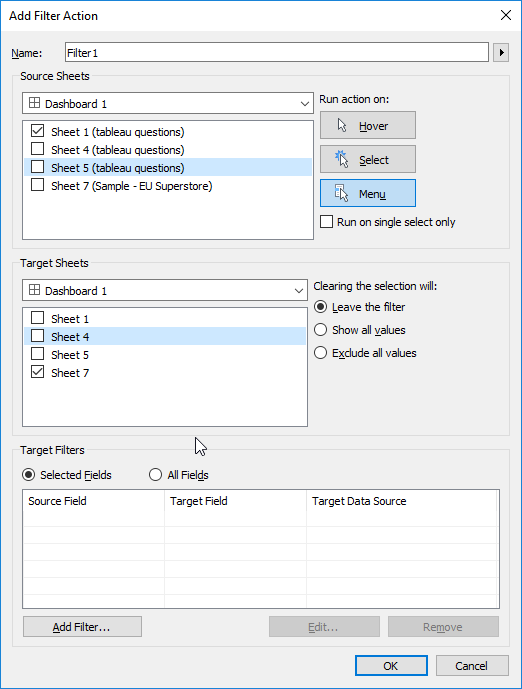
2. Select the filter action and sheets to apply filters.

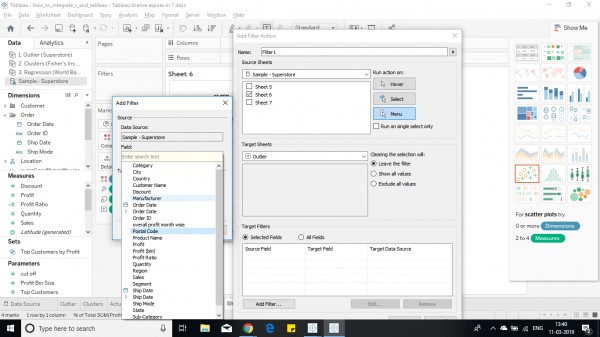
3, Then Select source and destination sheets. Below the targets select selected fields to show fields/measures that are not present on the chart. Click on add filter.


4. Then select the filed from the add filter dialog box. and click okay. Thus filter can be added using measures which are not used in charts.
Hope this helps you.
 REGISTER FOR FREE WEBINAR
X
 Thank you for registering
Join Edureka Meetup community for 100+ Free Webinars each month
JOIN MEETUP GROUP