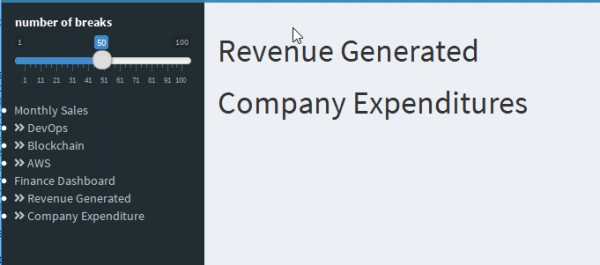
I’m trying to create a dashboard using shiny R. this is my ui.R and server.R files
Ui.R
library(shiny)
library(shinydashboard)
shinyUI(
  dashboardPage(
    dashboardHeader(title="Edureka"),
    dashboardSidebar(
      sliderInput("bins","number of breaks",1,100,50),
      menuItem("Monthly Sales",tabName = "dashboard"),
    menuSubItem("DevOps",tabName = "DevOps"),
    menuSubItem("Blockchain",tabName = "Blockchain"),
    menuSubItem("AWS",tabName = "AWS"),
    menuItem("Finance Dashboard"),
    menuSubItem("Revenue Generated",tabName = "Revenue"),
    menuSubItem("Company Expenditure",tabName = "Expenditure")),
    dashboardBody(
      tabItems(
        tabItem(abName = "dashboard",
        fluidRow(
          box(plotOutput("$histogram")))
        ),
        tabItem(tabName = "DevOps",
            h1("DevOps courses sold")
         ),
        tabItem(tabName = "Blockchain",
                h1("Blockchain courses sold")
                ),
        tabItem(tabName = "AWS",
                h1("AWS Courses sold")
                )),
        tabItem(tabName = "Revenue", h1("Revenue Generated")),
        tabItem(tabName = "Expenditure",h1("Company Expenditures"))
      )
    )
)

I want revenue generated and company expenditure in revenue generated and company expenditure section under finance dashboard.
 REGISTER FOR FREE WEBINAR
X
 Thank you for registering
Join Edureka Meetup community for 100+ Free Webinars each month
JOIN MEETUP GROUP