Facing some issues with Data Blending

0 votes
I have two tables: 1)The first one Which stores the countries in 2columns(country id INT & country name STRING)

2)second table where I keep the customer data including (country id INT & id of the user)

My plan is to present visually how many users I have per country by counting the id of the user, but I can't do the mapping of the country id.

Can someone help me to resolve it?
Oct 10, 2018 in Tableau by Atul
• 10,240 points
1,045 views

2 answers to this question.

+1 vote

Hey Grim, 

First you use inner joins instead of blending so that you will have one final data source. After that change the type country name from string to Geographical role (Country/Region) in the data source tab. After you will be good to plot the data

answered Oct 10, 2018 by ffdfd
• 5,550 points
0 votes

Hey, if you are trying for 2 different sources (tables) then you can use join or data blending .

You can prefer to use joins as the tables have same field names, or else data blending.

If you are using data blending, check if you have the link connected ( RED COLOR ) to establish connection between the 2 tables, then try it will work
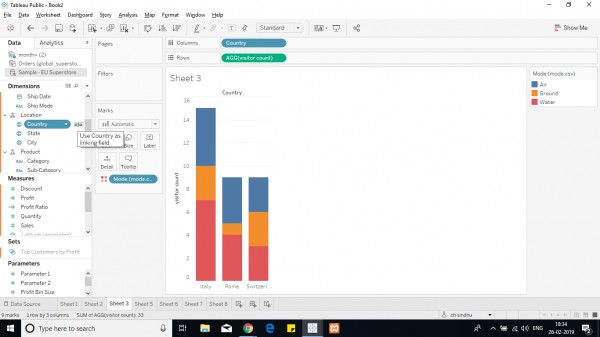
Or else it would show a warning message like this .(here sample - EU Superstore is my data source, if i try to use fields from 2 tables it would pop up a warning) 

so try again after connecting try again!!.
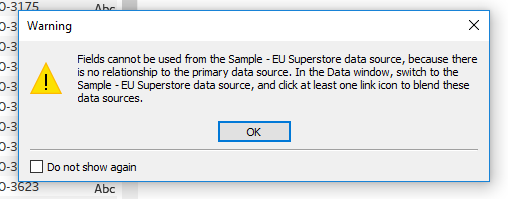
Hope this helps you.

answered Feb 27, 2019 by Cherukuri
• 33,030 points

edited Feb 27, 2019 by Cherukuri

Related Questions In Tableau

0 votes
0 answers

Issues with the Tableau server extracts

A tableau developer had successfully created dashboard ...READ MORE

Apr 21, 2018 in Tableau by Atul
• 10,240 points
712 views
0 votes
1 answer

Highlight data with an filter/parameter

Hi, Follow below steps: 1. When you add ...READ MORE

answered Apr 1, 2019 in Tableau by Cherukuri
• 33,030 points
754 views
0 votes
0 answers

show 2 charts with different data

Hi All, My requirement is to show 2 ...READ MORE

Oct 21, 2019 in Tableau by ch
• 3,450 points
496 views
0 votes
1 answer

How to replace the count(field) which is missing in data with zero in tableau?

Use calculated field to create a dummy ...READ MORE

answered Dec 21, 2019 in Tableau by sindhu
2,022 views
+1 vote
1 answer

Is it possible to access or install tableau desktop insde tableau server?

Try to understand this, Tableau Server and ...READ MORE

answered Mar 30, 2018 in Tableau by xyz
• 1,560 points

edited Mar 30, 2018 by xyz 857 views
0 votes
1 answer

Hover text shows numbers in decimal points

Do this: 1. Right click on the calculated ...READ MORE

answered Apr 3, 2018 in Tableau by QueenBee
• 1,820 points
958 views
0 votes
1 answer

Dropdown to change x-axis in Tableau

You need to create a  str datatype parameter ...READ MORE

answered Apr 4, 2018 in Tableau by QueenBee
• 1,820 points
1,293 views
0 votes
1 answer

Tableau Desktop- Tableau Server

No, you don't necessarily need to purchase ...READ MORE

answered Apr 4, 2018 in Tableau by QueenBee
• 1,820 points
730 views
+2 votes
1 answer
0 votes
1 answer

Issues with the Range value in Tableau

One of the best solution is to ...READ MORE

answered May 9, 2018 in Tableau by ffdfd
• 5,550 points
1,221 views
webinar REGISTER FOR FREE WEBINAR X
REGISTER NOW
webinar_success Thank you for registering Join Edureka Meetup community for 100+ Free Webinars each month JOIN MEETUP GROUP